⚡Quick answer
Design drives client choice by managing cognitive load and creating visual hierarchy. Conversion design uses neuromarketing to direct attention toward a target action, minimizing friction through intuitive navigation (UX), emotional triggers (UI), and visual proof of expertise.
Imagine a user searching for a service and opening five tabs at once. Five sites, five promises. Within seconds, four of them close. Which one does the person stay on?
The answer is almost always the same: the one where they felt trust before reading a single word. Research shows that an impression of a website forms within 50 milliseconds — faster than the brain can even process what it read. That’s exactly where design starts working as a sales tool.
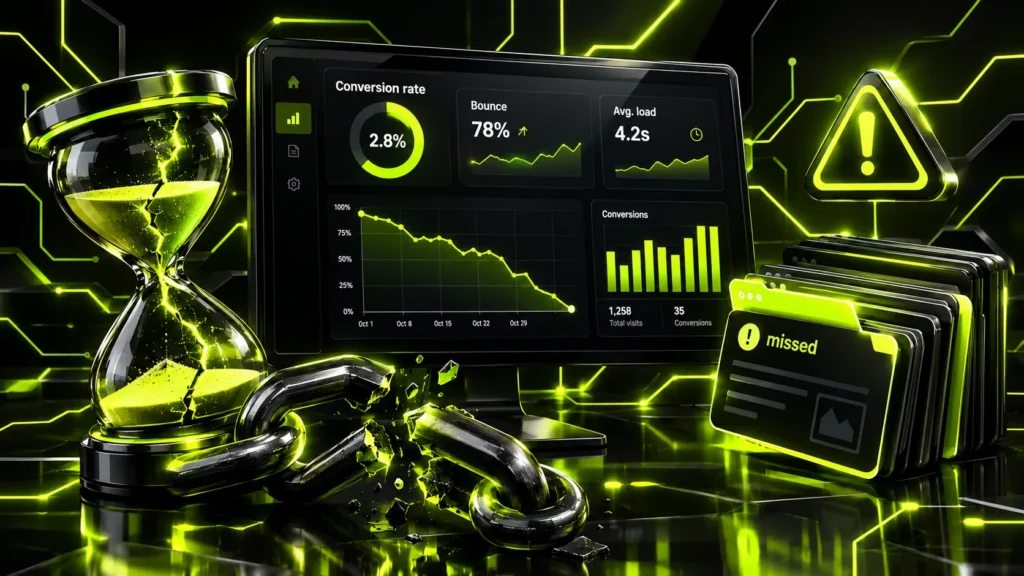
Clients don’t leave over price — they leave because the interface made them think. In design psychology, this is called friction — the invisible cognitive strain that builds up when the path to a result becomes confusing.
Where friction usually hides:
Advice from Netloria: “A client doesn’t read your site — they scan it. If they don’t understand where they are and what to do within the first 3 seconds, no amount of copy in the world will stop them from leaving. Conversion design is built around scanning, not reading.”
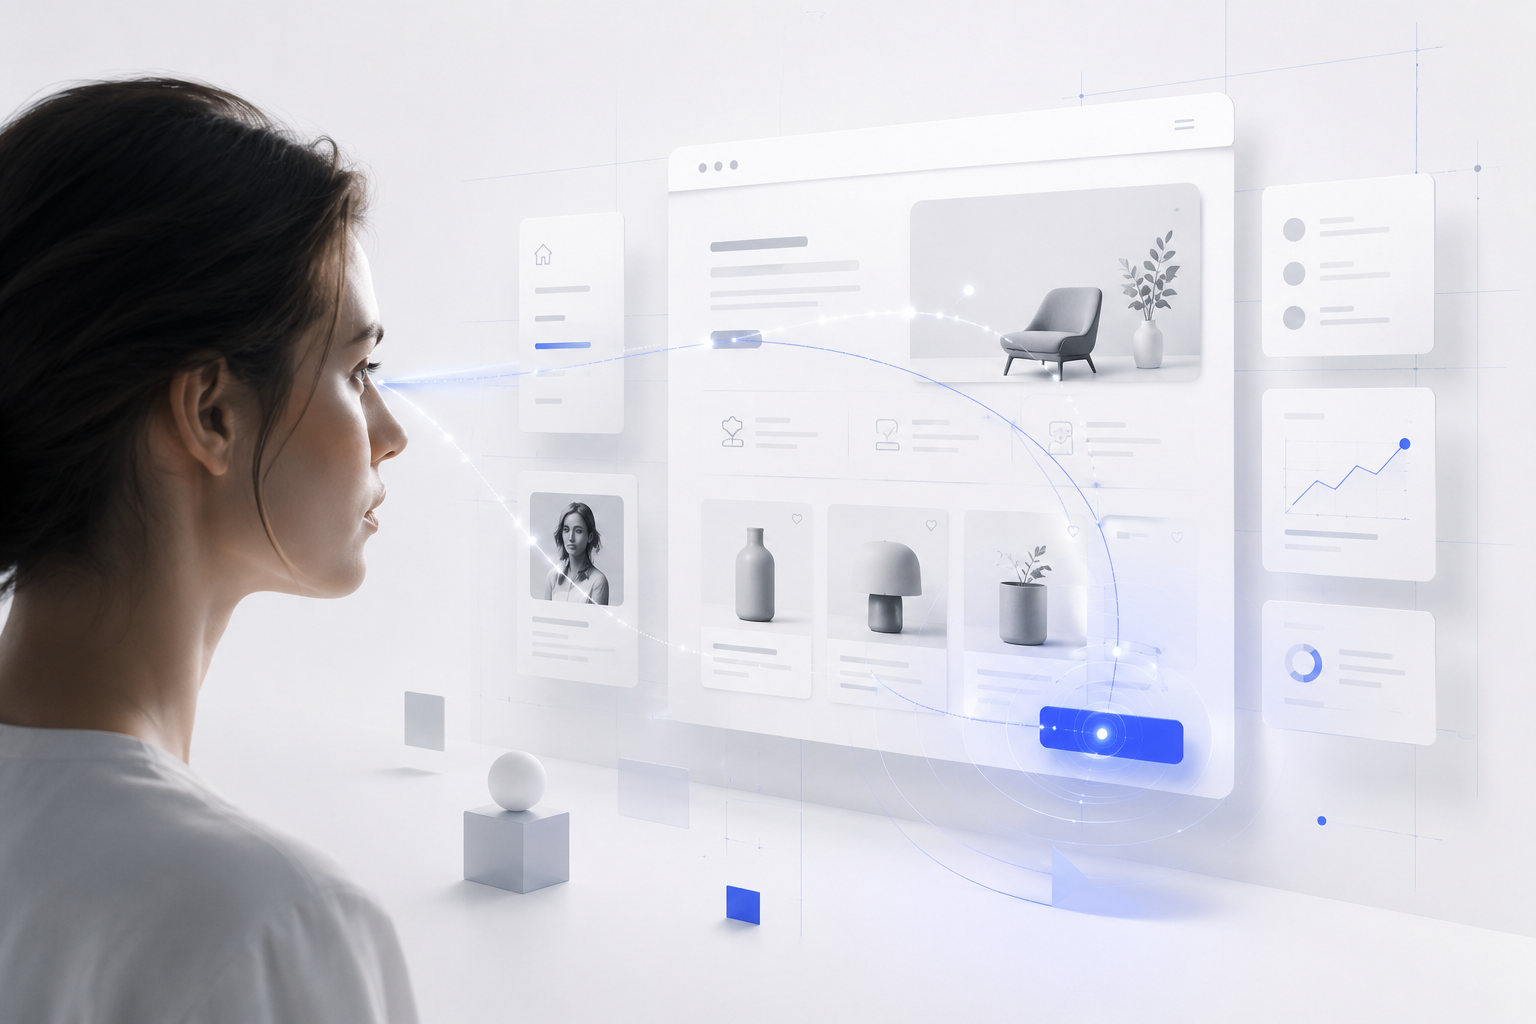
User Experience (UX) is the psychology of movement. It’s an architecture where every client question gets answered exactly when it comes up.
If UX is a site’s skeleton, UI is the brand’s face. It’s the part of design that shapes the first impression before a user reads anything. And this is exactly where the invisible tools work best.
Advice from Netloria: “Compare your site to the leader in your niche. If you can’t find 3 compelling reasons to stay on your site within the first 10 seconds, your design is working for your competitor.”
Color is the fastest route to the subconscious. It acts before the eye can even register shapes. But it’s not just about the emotional code of each shade — it’s about a systematic approach.
Let’s look at real examples:
Facebook isn’t blue by accident. Mark Zuckerberg is colorblind, and blue is the color he sees best. But it happened to work out well: blue is universally read as “reliability, stability, security.” That’s why most financial institutions and social networks use it. Tesla uses black as its dominant color — a signal of status, exclusivity, and premium quality. MailChimp used to be yellow — a symbol of energy, friendliness, and lightheartedness, which fit perfectly with its “pain-free email marketing” positioning.
A classic example: HubSpot once ran an A/B test on two button colors — green versus red. Red won, generating 21% more clicks. Not because red is “magic” — but because it contrasted with the site’s primarily green color palette, while the green button blended into the background.
But the key thing in conversion design isn’t the color itself — it’s contrast. Your target CTA button should be the only object of that color on the screen, so the brain instantly identifies it as the “way out” or the action to take.
In Netloria’s strategy, graphic design is “visual proof.” Users have learned to tell the difference, in seconds, between a stock model with a gleaming smile and a real photo of an actual team. Authenticity is the new currency.
Strong brands invest in three types of visual content:
Today, mobile-first isn’t an adaptation — it’s the baseline. And if your design “adapts” to mobile instead of being designed for mobile from the start, you’re losing the bulk of your clients before they even reach your pricing.
The most common mistake is ignoring the thumb zone. Smashing Magazine published Steven Hoober’s research back in 2013: 49% of users hold their phone in one hand, operating it with their thumb. That means the bottom two-thirds of the screen is the “golden zone,” while the top corners are “dead zones.” If your main CTA button sits in the top-right corner of the screen, you’re literally asking the user to stretch their thumb somewhere uncomfortable.
Touch targets should be no smaller than 44×44 pixels, and the most important navigation elements should sit in the bottom two-thirds of the screen. Per Core Web Vitals standards, load time (LCP) should be under 2.5 seconds. Every extra second of waiting increases the bounce probability by 32%.
There’s an entire category of techniques that could be called the “dark side” of conversion design — dark patterns. These are interface tricks deliberately designed to mislead users in order to boost short-term conversion.
The examples are familiar to almost everyone: a pre-checked box for a paid subscription during checkout; a subscription-cancellation form buried five clicks deep; a “free trial” that automatically turns into a paid plan with no warning; an “accept all cookies” button noticeably bigger than “customize settings.”
At Netloria, we build design on ethics. Trust is an asset you cannot build through deception. A client who was manipulated into acting will never come back, and will never recommend you to anyone else.
We don’t guess — we analyze data. Four tools confirm an interface’s effectiveness:
The difference between a “nice-looking site” and a “profitable site” isn’t about budget — it’s about mindset. One satisfies the owner’s aesthetic preferences; the other moves business metrics.
| Characteristic | Ordinary Design | Conversion Design (Netloria) |
| Main Goal | Aesthetics | Conversion growth and ROI |
| Logic | Creative exploration | Customer journey (CJM) |
| Elements | Decorative | Functional focal points |
| Analytics | “Like it — don’t like it” | A/B tests, heatmaps, usability testing |
| Result | “Just pretty” | “Usable, logical, profitable” |
A good website isn’t one that’s pleasant to look at. It’s one where a client reaches the order button without any friction. If your current site “seems to have everything” but inquiries are low, the problem is almost never traffic. It’s how that traffic perceives your interface within the first 50 milliseconds.
The Netloria team designs websites that work for business metrics, not beauty for its own sake. If you have an idea, or a current project that needs a rethink — let’s talk.